
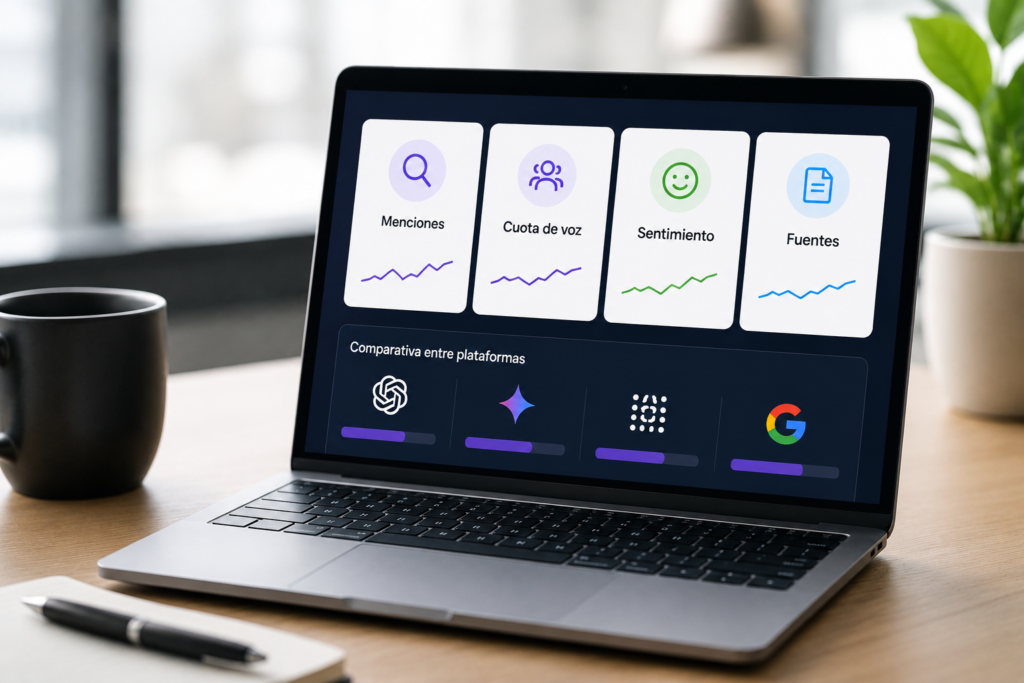
Marketing teams use dashboards to monitor traffic, campaigns, conversions, and search rankings. However, an increasing share of brand discovery now takes place within ChatGPT, Gemini, Perplexity, and Google AI Overviews.
In these environments, a company can be recommended, compared with its competitors, or even described inaccurately without the user ever visiting its website. That is why measuring only clicks, sessions, and SEO rankings no longer provides a complete picture.
An AI visibility dashboard should answer four key questions:
- Is the brand appearing?
- How is the AI presenting the brand?
- What position does it hold compared to its competitors?
- What actions can the marketing team take to improve its visibility?
What Is an AI Visibility Dashboard?
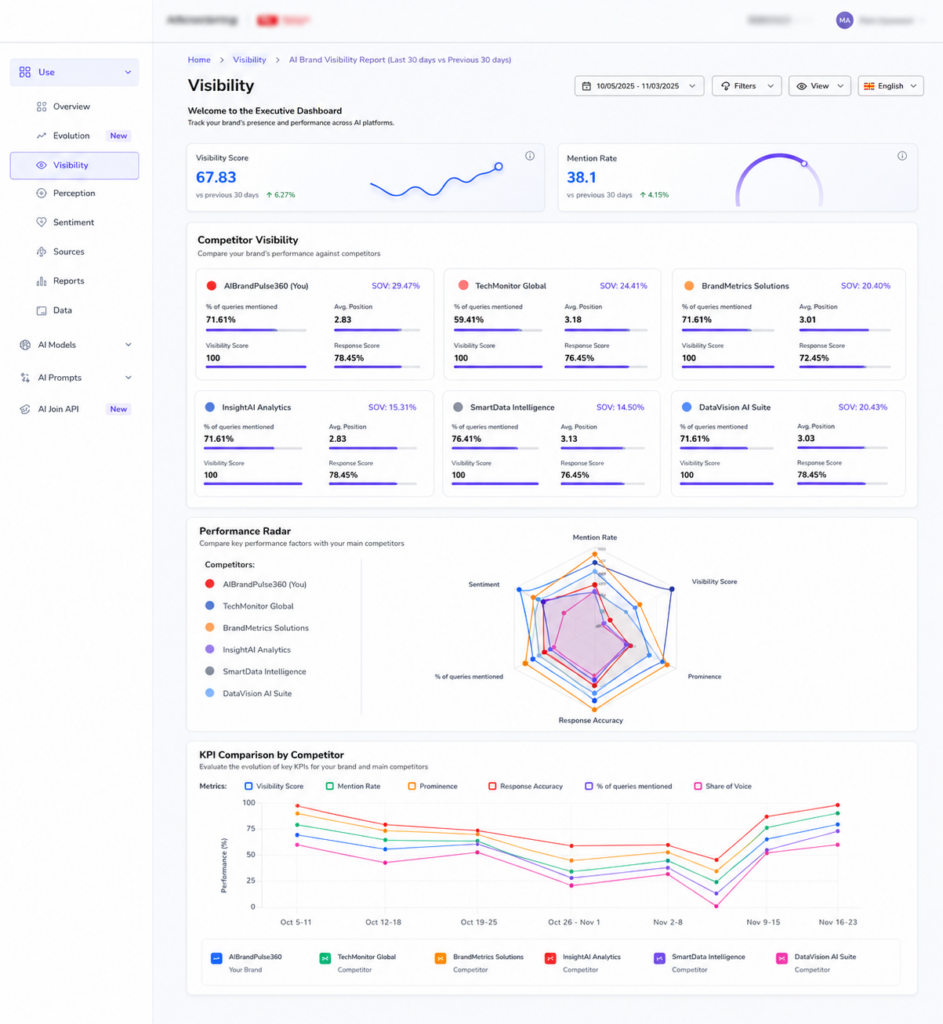
It is a dashboard that analyzes how a brand appears in the responses generated by artificial intelligence platforms.
Unlike an SEO dashboard, which measures rankings, impressions, and clicks, this dashboard analyzes prompts, brand mentions, recommendations, sentiment, and sources.
Both approaches are complementary. SEO shows which pages appear in search engines, while AI visibility reveals whether a company is part of the AI-generated responses that influence users’ decisions.
The Metrics That Really Matter
A dashboard does not need dozens of metrics. It needs to display the data that helps the marketing team identify problems and opportunities.
Mention Rate
The mention rate shows how often a company appears in the set of AI responses analyzed.
For example, if the brand appears in 30 out of 100 responses, its mention rate is 30%.
This metric should be filterable by platform, country, language, product, and query type. A strong overall mention rate may still hide the fact that the company is absent from product comparisons or buying recommendations.
To obtain reliable insights, it is essential to monitor brands in LLMs using a consistent set of business-relevant prompts.
AI Share of Voice
AI Share of Voice compares your brand’s mentions with those of its competitors.
It does more than reveal which company appears most often. It also helps identify which businesses dominate specific categories, markets, or stages of the customer journey.
A competitor may receive fewer total mentions but appear far more frequently in prompts such as “What is the best tool?” or “Which provider should I choose?”
Brand Prominence
Not all mentions carry the same value.
Being the first recommendation has a much greater impact than appearing at the end of a list. For this reason, the dashboard should distinguish between:
- First recommendation.
- Included among the top alternatives.
- Secondary mention.
- Referenced only as a source or citation.
This metric makes it possible to distinguish between simple brand presence and visibility that is likely to influence a user’s decision.
Sentiment and Brand Perception
Marketing teams need to understand not only whether their brand appears, but also how it is described.
Beyond classifying mentions as positive, neutral, or negative, it is useful to analyze the attributes associated with the brand, such as innovation, pricing, quality, trust, ease of use, or customer support.
If the detected perception does not match the desired positioning, it may be necessary to adjust the company’s content strategy, communications, or AI reputation efforts.
Information Accuracy
Even a positive mention can be harmful if it contains inaccurate information.
The dashboard should detect errors related to:
- Pricing and commercial terms.
- Available products or services.
- Features and functionality.
- Locations.
- Integrations.
- Competitor comparisons.
Each issue should include the original response, the AI platform, the date, and the likely source of the error. This enables the team to identify and correct the information influencing AI-generated answers.
Visibility in Non-Branded Queries
Queries that include the company’s name are useful for measuring reputation, but non-branded prompts reveal its true discovery potential.
For example:
- “What is the best tool for measuring a brand’s AI visibility?”
- “Which platforms can analyze mentions in ChatGPT?”
- “How can I compare my AI visibility with that of my competitors?”
Appearing in these types of queries means the AI associates the company with a specific need or category, even when the user has not yet heard of the brand.
Comparing AI Platforms
ChatGPT, Gemini, Perplexity, and Google AI Overviews do not always rely on the same sources or generate the same recommendations.
For this reason, the dashboard should make it possible to compare:
- Mention rate.
- Share of Voice.
- Brand prominence.
- Sentiment.
- Accuracy.
- Sources used.
Understanding how ChatGPT, Gemini, and Perplexity influence brand visibility helps prevent decisions based solely on the results of a single AI model.
Comparisons should always be made using the same prompts, languages, countries, and time periods. Otherwise, the data will not be truly comparable.
Which Sources Influence AI Responses?
One of the most valuable sections of the dashboard is the source analysis.
AI systems may rely on information from corporate websites, news outlets, blogs, directories, comparison sites, forums, or third-party pages. These sources influence both brand visibility and brand perception.
The dashboard should display:
- Domain and URL.
- Owned or external source.
- Brand benefiting from the source.
- Prompts in which the source appears.
- Associated sentiment.
- Content publication date.
An AI visibility tool should enable users to move from an AI-generated response directly to the web pages that may be influencing it.
Based on this analysis, the marketing team can decide whether to update an existing page, create new content, gain coverage in a media outlet, or correct inaccurate information on an external source.
Turning Data into Action
The true value of an AI visibility dashboard comes when every insight leads to a concrete action.
| Finding | Recommended Action |
| Low visibility in non-branded queries | Create content focused on user problems, categories, and use cases |
| A competitor dominates Share of Voice | Analyze their sources, messaging, and topical coverage |
| The AI provides inaccurate information | Update your own pages and external references |
| The brand appears with negative sentiment | Identify the sources and review your reputation strategy |
| The brand is mentioned but lacks prominence | Strengthen differentiation and authority signals |
| The brand appears in informational content but not in recommendations | Create comparison pages and decision-stage content |
| One AI platform performs worse than the others | Compare the sources and signals used by each model |
How the Dashboard Should Be Structured
The dashboard should first provide an executive overview and then allow users to drill down into the details.
The top section should display:
- Overall AI Visibility Score.
- Mention Rate.
- Share of Voice.
- Sentiment.
- Change compared with the previous period.
- Key alerts.
From there, users should be able to explore the data by platform, country, language, product, competitor, and query type.
Finally, every issue should be linked to a recommended action, a priority level, and an owner. A digital marketing team does not simply need to know that visibility has declined—it needs to understand why and what should be done to recover it.
Mistakes an AI Visibility Dashboard Should Avoid
A dashboard loses its value when it:
- Displays metrics without comparing them against competitors or previous periods.
- Uses too few prompts or prompts that are not representative.
- Mixes countries, languages, and AI platforms.
- Treats every mention as equally valuable.
- Fails to preserve the original AI responses.
- Does not identify the sources.
- Does not assign owners or actions.
- Shows activity instead of measurable outcomes.
It is also important to maintain a stable set of prompts. Constantly changing them makes it impossible to determine whether performance changes are due to the company’s strategy or simply the measurement process.
A Dashboard Designed for Decision-Making, Not Just Reporting
The best AI visibility dashboard is not the one with the most charts. It is the one that enables teams to move quickly from insight to action.
It should help marketing teams:
- Correct inaccurate information.
- Improve content.
- Strengthen high-value sources.
- Identify opportunities against competitors.
- Protect brand reputation.
- Measure the impact of optimization efforts.
AIBrandpulse360 analyzes brand mentions, perception, sentiment, competitors, and sources across the leading AI platforms. This enables marketing teams to understand not only where their brand appears, but also how it is presented and what needs to be improved.
Discover what AIBrandpulse360 measures and how to turn AI visibility into an actionable growth strategy.

 Sep 11, 2026


